Some Thoughts on DAC Matching
Introduction
Motivated by Paul's producing fits for all the DAC measurements
and studying yields as a function of various cuts, and by Mitch's
pulling up the numbers on nominal Vt matching, we realized
that we could learn quite a bit quantitatively by looking at matching
within a DAC. Specifically, by actually plotting a histogram of
the differences between DAC output for 16 versus 15, 32 versus 31,
64 versus 63 and n versus n-1 in general, we essentially get a direct
measure of the RMS variation in output as a function of device size.
(One of course has to allow for the 5mV offset because the DAC counts
differ by
1).If we then combine this with the Vt sensitivity of the DAC output
from Mitch's simulation, we get a direct measurement of the Vt matching
as a function of device size (assuming other effects are negligible).
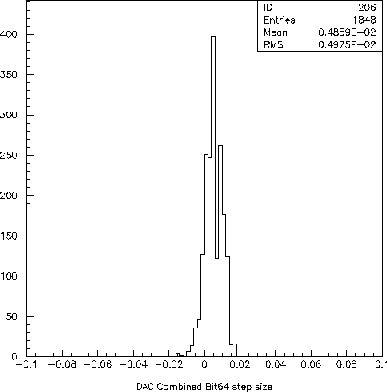
Deduction of Effective Vt matching from Observed Matching within a DAC
The difference in DAC output for DAC value N
and N-1 was computed for each of the following values of N. The
result is effectively a measurement of the matching for two different
blocks of identical transistors. For example,
N = 64 selects a group of sixty-four 5 x 5 micron transistors, while
DAC value 63 selects a different set of 63 identical transistors.
The RMS
|
Bit (N)
|
Sigma (mV)
|
|
2
|
0.75
|
|
4
|
0.83
|
|
8
|
0.92
|
|
16
|
1.17
|
|
32
|
2.45
|
|
64
|
4.98
|
|
128
|
9.6
|
Table 1: RMS Differences between DAC output for
setting of N and N-1
The sensitivity of DAC output to Vt from Mitch's simulation is
Delta Vout = 13 mV for Delta Vt = 1 mV
(for full scale).
Clearly for 128 bits, the sensitivity would be 6.5 mV per 1mV delta
Vt, for 64 bits
it would be 3.25mV per 1mV Vt shift, etc. From this one can then
deduce
the following effective Vt matching. We also present the total transistor
area
of the N devices.
| Bit (N) |
Area |
Vt |
| 32 |
800 |
1.48 |
| 64 |
1600 |
1.53 |
| 128 |
3200 |
1.51 |
Table 2: Effective Vt matching Deduced from Table
1.
Area Scaling Evidently Doesn't Work for Large Devices (that are not interleaved)
We see that rather than scaling smaller as a function of area,
the effective Vt matching is independent of area. Perhaps our expectations
of area scaling were a bit naive. If one has two devices that are located
rather close to one another (close enough that there are no systematic
effects)
then one would expect, and does typically observe, scaling as a function
of 1/SQRT(A). However, the devices in the DAC are rather large and
are not
particularly close to one another. Further more they are not in a "cross-quad"
arrangement that might remove systematic effects to first order. Also,
1.5mV is (at least by historical standards) rather good matching for
MOS
devices. Thus it is very possible that by the time one gets to Vt matching
this small, and devices this large, there is no further improvement
with
area. If devices that are separated by some significant distance see
a
SYSTEMATIC Vt difference of 1.5 mV, doubling the number of devices
will
not improve the matching.
Deduced Vt matching not far from that expected from recent TEMIC measurements
It is worth noting that the magnitude of the matching is
not far from what is expected based on recent TEMIC measurements, as
opposed
to numbers they quoted originally in RDER2401 DMILL ELECTRICAL
DESIGN RULES.
Specifically, Mitch derives a MATCHVTP of 70mv-microns which
would predict a Vt matching of 1.2mV for a 640/5 devices (128 bit).
Summary of Matching
Based on the above, we could argue that (1) we have reasonably
good "direct" measurements of the effective matching and (2) for
increasingly large devices, the effective Vt shift does not improve
further with size. Hence the RMS output variation of DAC output will
scale with the total number of bits. In this case, we can readily conclude
that if we observe an RMS of 9.6 mV for 128 counts, then we would
expect an RMS of about 20 mV for 255 counts.
Implications for DAC Output Uniformity
Most of you will note that this value still seems small
compared to the 100mV + variations that we observe from DAC to DAC.
While this
is true, if we look at a combined histogram of the percentage
differences between the following pairs of DAC's L0H0,
L0H1, and H0H1 (the three closest to one another), then we
observe rather clearly again a "two component distribution". The
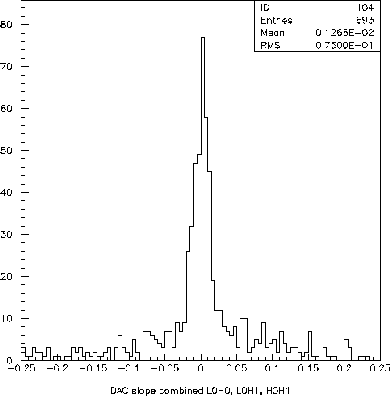 center
of the distribution, containing perhaps 60 - 70% of the DAC pairs, is
rather gaussian and has sigma of (believe it or not) about 1.3%. This
then corresponds to a sigma of the difference in the full scale range
of the DAC's of only 17mV. This compares remarkably well with the 20mV
estimated above (since we are now comparing two DIFFERENT DAC's, rather
than two different pieces in the same DAC, one has to think carefully
about whether we would expect it to be worse by another factor of 1.4;
I think
not,but more thought is warranted).
center
of the distribution, containing perhaps 60 - 70% of the DAC pairs, is
rather gaussian and has sigma of (believe it or not) about 1.3%. This
then corresponds to a sigma of the difference in the full scale range
of the DAC's of only 17mV. This compares remarkably well with the 20mV
estimated above (since we are now comparing two DIFFERENT DAC's, rather
than two different pieces in the same DAC, one has to think carefully
about whether we would expect it to be worse by another factor of 1.4;
I think
not,but more thought is warranted).
Overall Summary
While there are certainly uncertainties in the above, I think
we can now say the following
The RMS agreement between most (60 - 70%) of
the DAC's is consistent with coming from a (measured) effective Vt matchng
of about 1.2 mV.
However, we are left still not understanding why
30 - 40% of the DAC's match much more poorly, with variations of 10 - 20%.