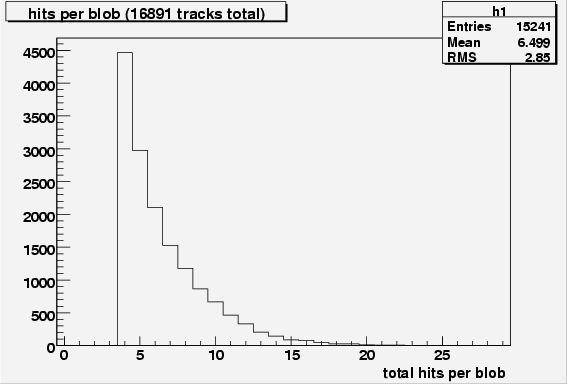
| This is a plot of the number hits in each of the blobs found in a run with AR-CO2, argon shaping, a low threshold of 125, and a high threshold of 183. A blob has been defined as a group of at least 4 hits straws that are all connected by neighboring hit straws and which have an average number of hit neighbors of 2 or greater (this last criteria is included to rule out straight line blobs, which are most likely just unidentified tracks). | |
 |
 |
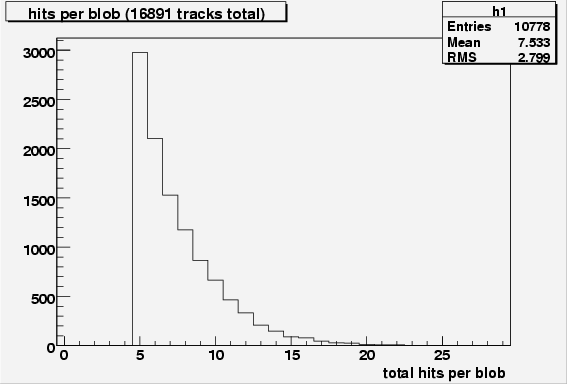
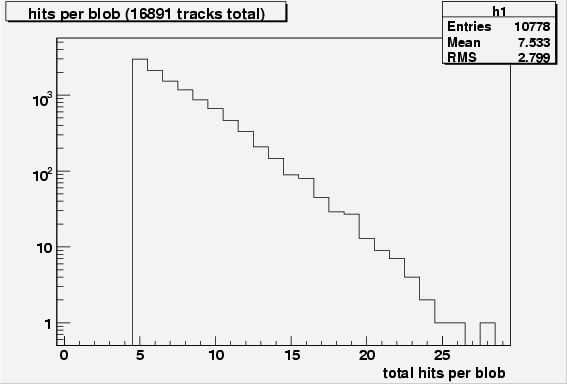
Here is the same thing with blobs restricted to 5 hits or more |
|
 |
 |
Here are a series of plots showing various time over threshold related plots for blobs. The case with blobs defined as 4 hits or more is on the left, with 5 hits or more on the right. |
|
 |
 |
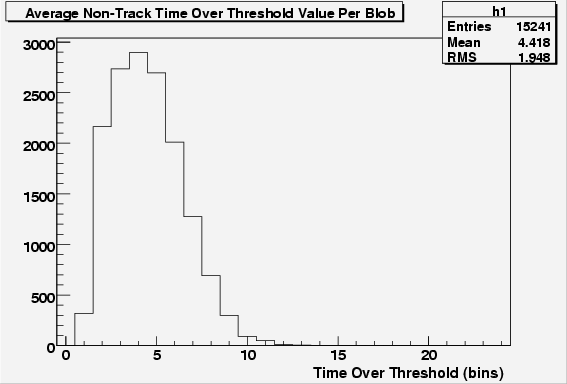 |
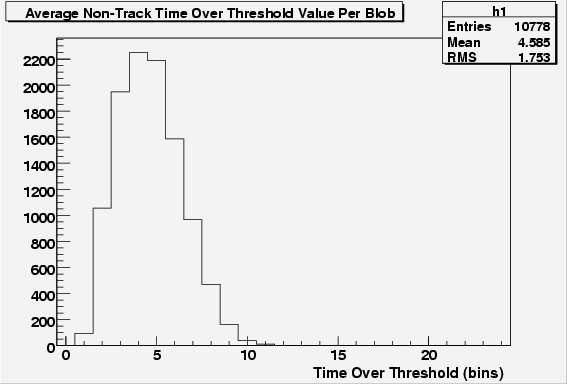 |
 |
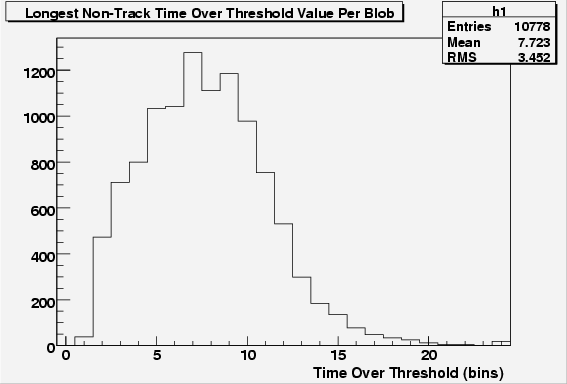 |
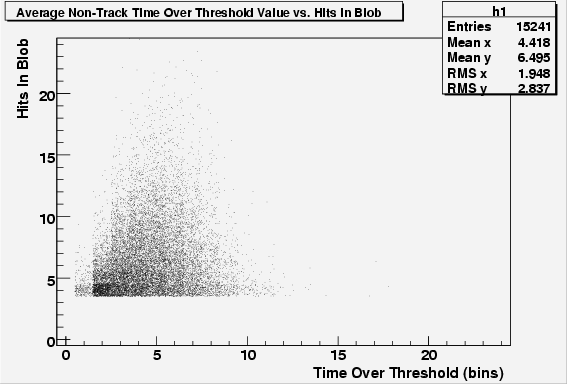 |
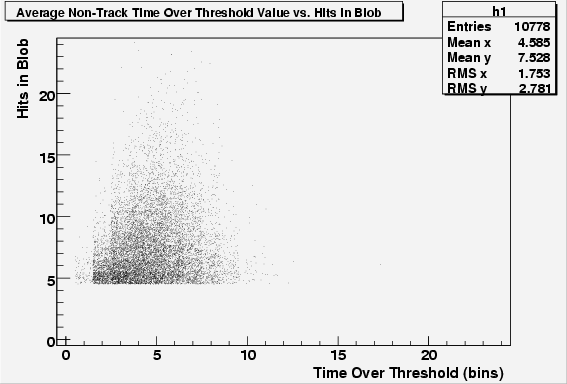 |
Here is a plot of the standard deviation of the leading edge time bin distribution for all blobs, again with 4+ hit blobs on the left and 5+ hit blobs on the right. |
|
 |
 |
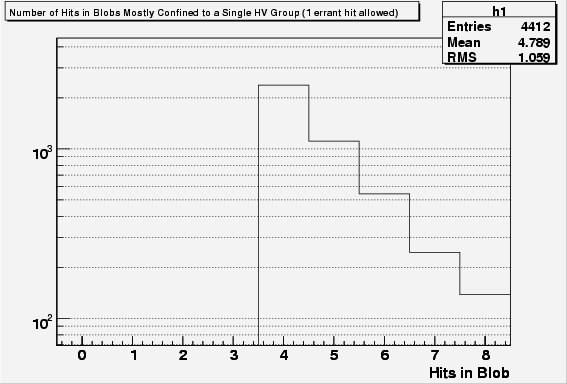
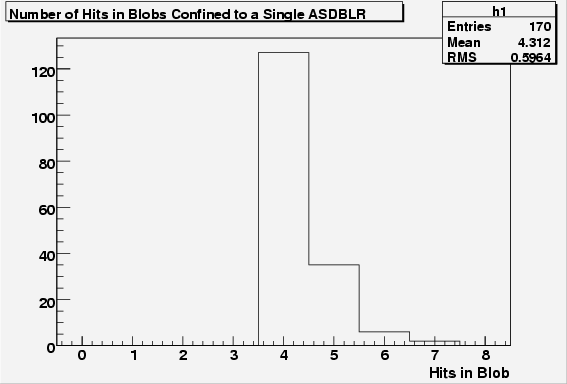
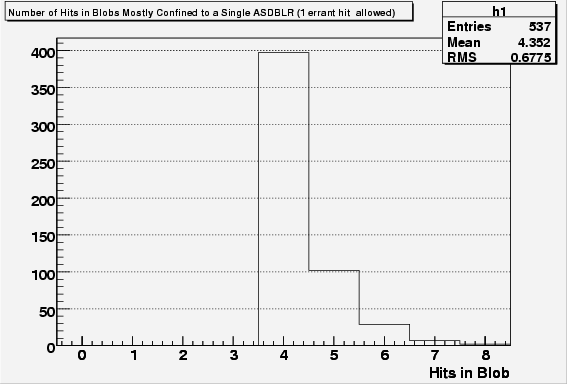
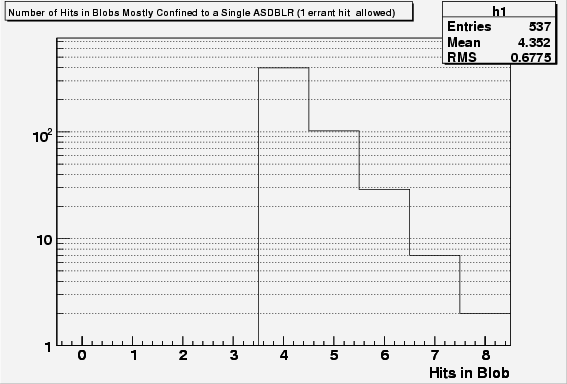
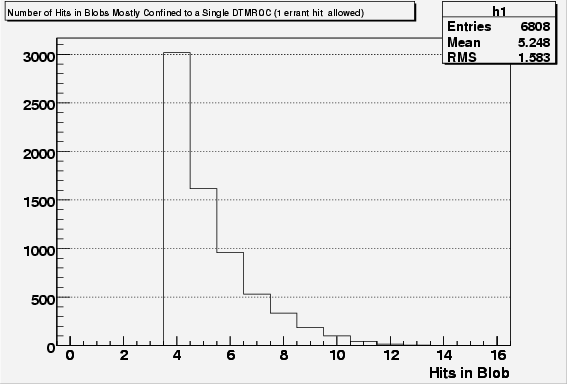
Here is a series of plots that show correlations of blobs to various hardware groupings (HV groups, ASDBLRs, and DTMROCs). For all groupings, there is one set of plots where only blobs that were entirely confined to the given group were allowed, and a second set of plots where one hit in the blob was allowed to fall outside the group in question. |
|
Here are the plots for HV groups |
|
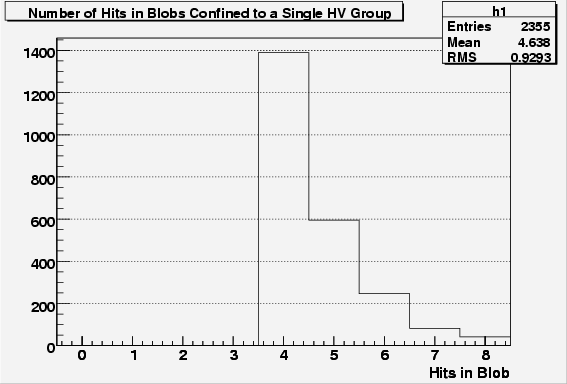 |
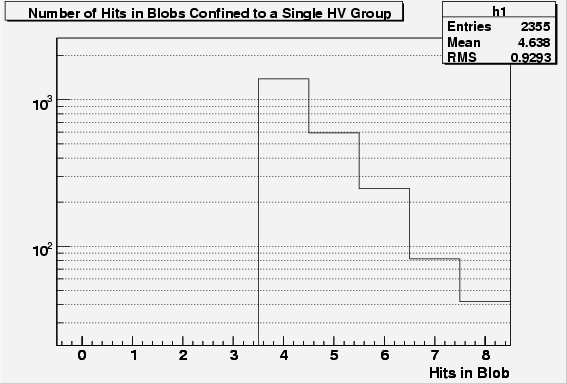 |
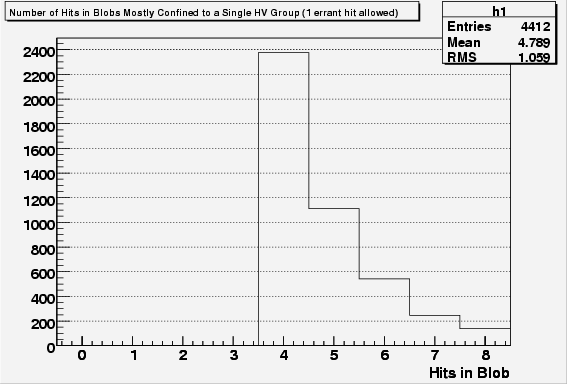 |
 |
Here are the plots for ASDBLRs |
|
 |
 |
 |
 |
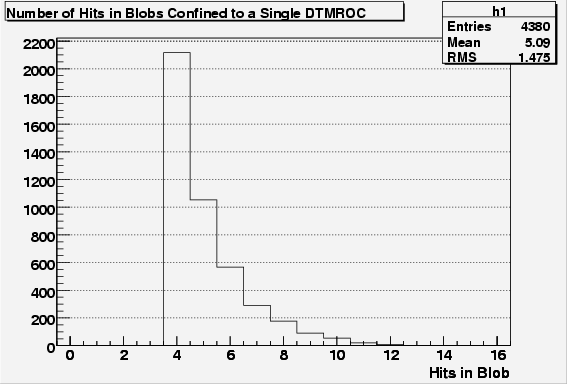
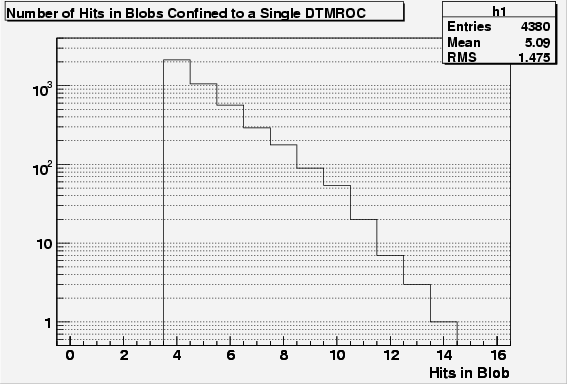
Here are the plots for DTMROCs |
|
 |
 |
 |
 |
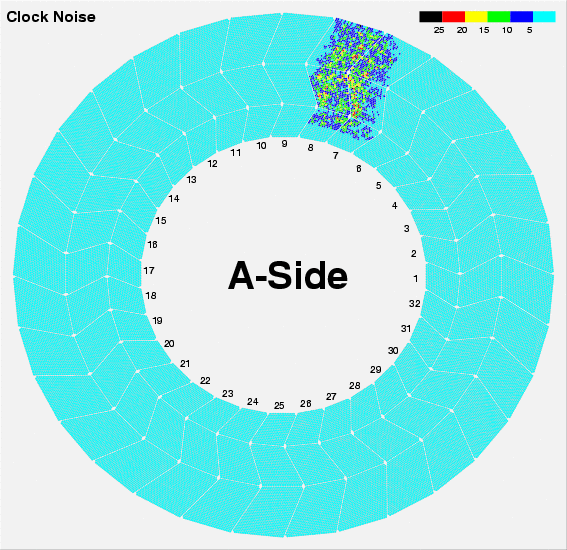
Here are geographical maps of the blobs hits that are found. Please ignore the part that says 'Clock Noise'. the scale represents number of hits, where only hits inside blobs are counted.
