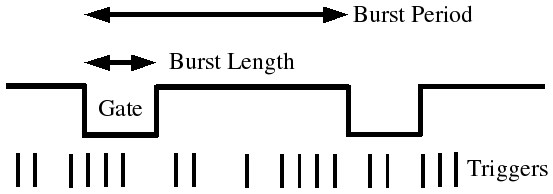
| Frequency of Triggers in Burst | Burst Length | Burst Period |
|---|---|---|
| 100kHz | 83μs | 200ms |
| 50kHz | 168μs | 200ms |
| 25kHz | 320μs | 200ms |
| 10kHz | 800μs | 200ms |
| 5kHz | 1.6ms | 200ms |
| 1kHz | 8ms | 200ms |
The integrated trigger rate was 40Hz; RODs started filling up too quickly at 80Hz. There were 6 RODs reading out, with 10 ROD groups per 3 RODs (out of a possible 12). I looked briefly at the low level noise occupancy and the crosstalk probability for each straw under different conditions. In all runs, the LL threshold was set to be (.5% occupancy) - (5 DAC counts) with Xe shaping, so approximately 123 DAC counts.
Low Level Noise Occupancy
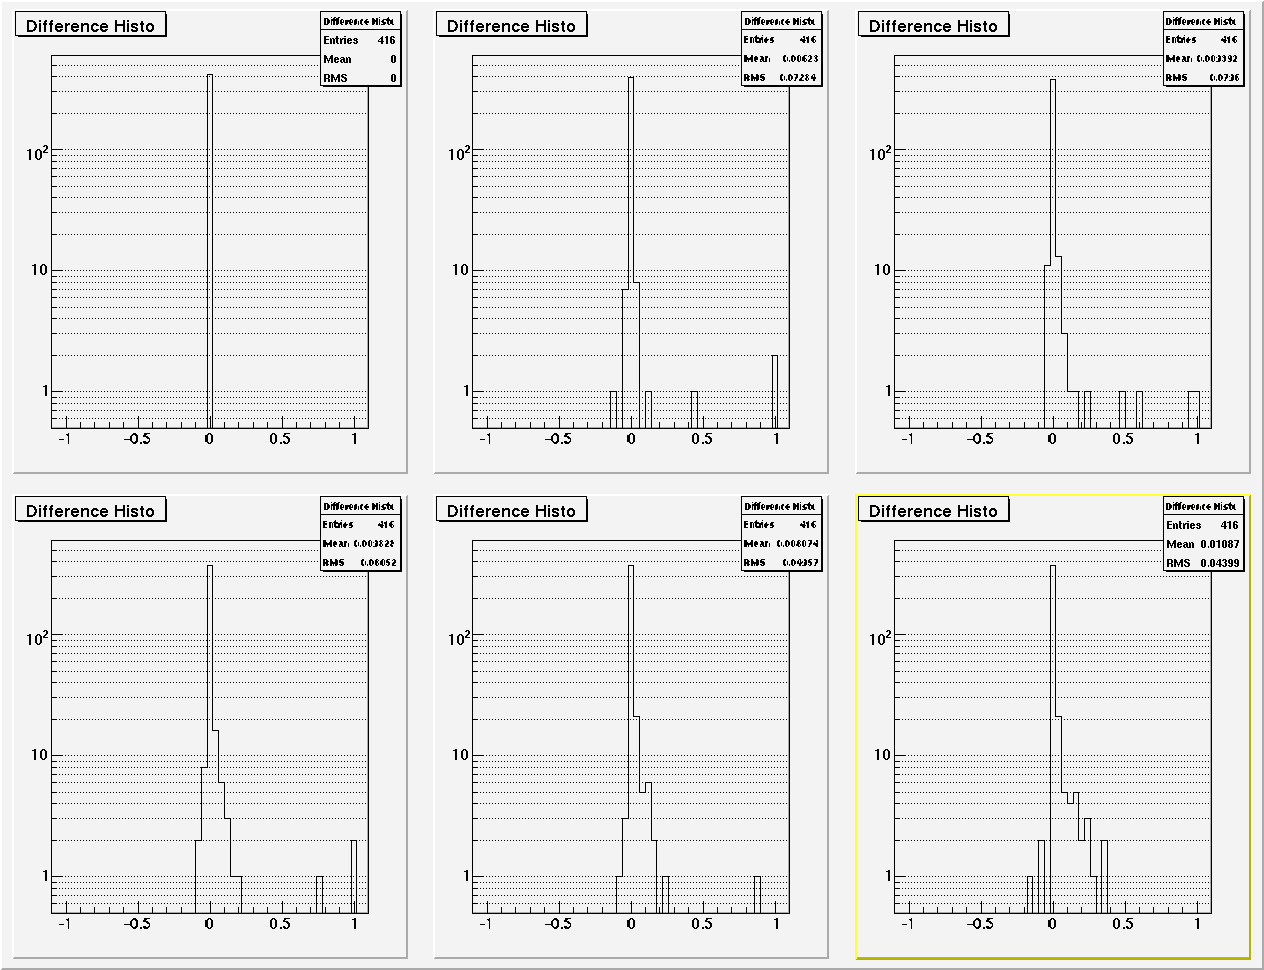
For each straw, find the percent occupancy at 100kHz and at 1kHz; subtract the result at 100kHz from the result at 1kHz; histogram the differences:

For every combination of runs, generate the plot above, and extract the mean:
For each straw, find the percent occupancy at 100kHz and at 1kHz; subtract the result at 100kHz from the result at 1kHz; histogram the differences:
For every combination of runs, generate the plot above, and extract the mean:
(Of course, the RMS is larger than the mean, so the error bars (not shown) are quite large relative to the data.)
Crosstalk
For each straw, find the probability that the corresponding straw on the opposite side will be occupied; subract the result at 100kHz from the result at 1kHz; histogram the differences:
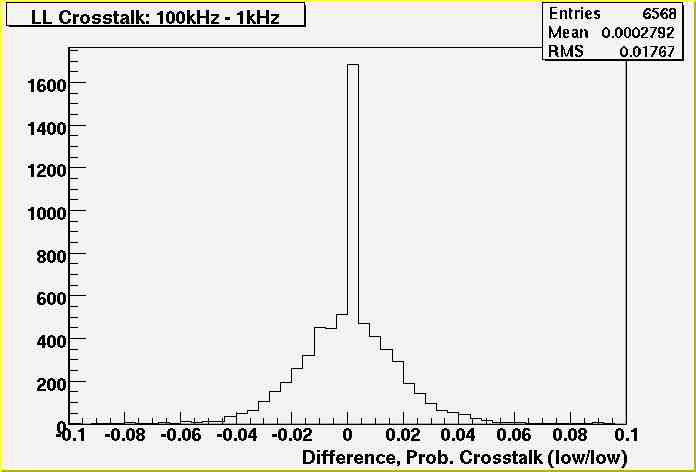
For every combination of runs, generate the plot above, and extract the mean:
For each straw, find the probability that the corresponding straw on the opposite side will be occupied; subract the result at 100kHz from the result at 1kHz; histogram the differences:
For every combination of runs, generate the plot above, and extract the mean:
(Of course, the RMS is larger than the mean, so the error bars (not shown) are quite large relative to the data.)
Notes on data integrity:
1) There were no orphan BCIDs for any chips in any of the burst-mode test runs. For every chip, in every event, all of the BCIDs matched.
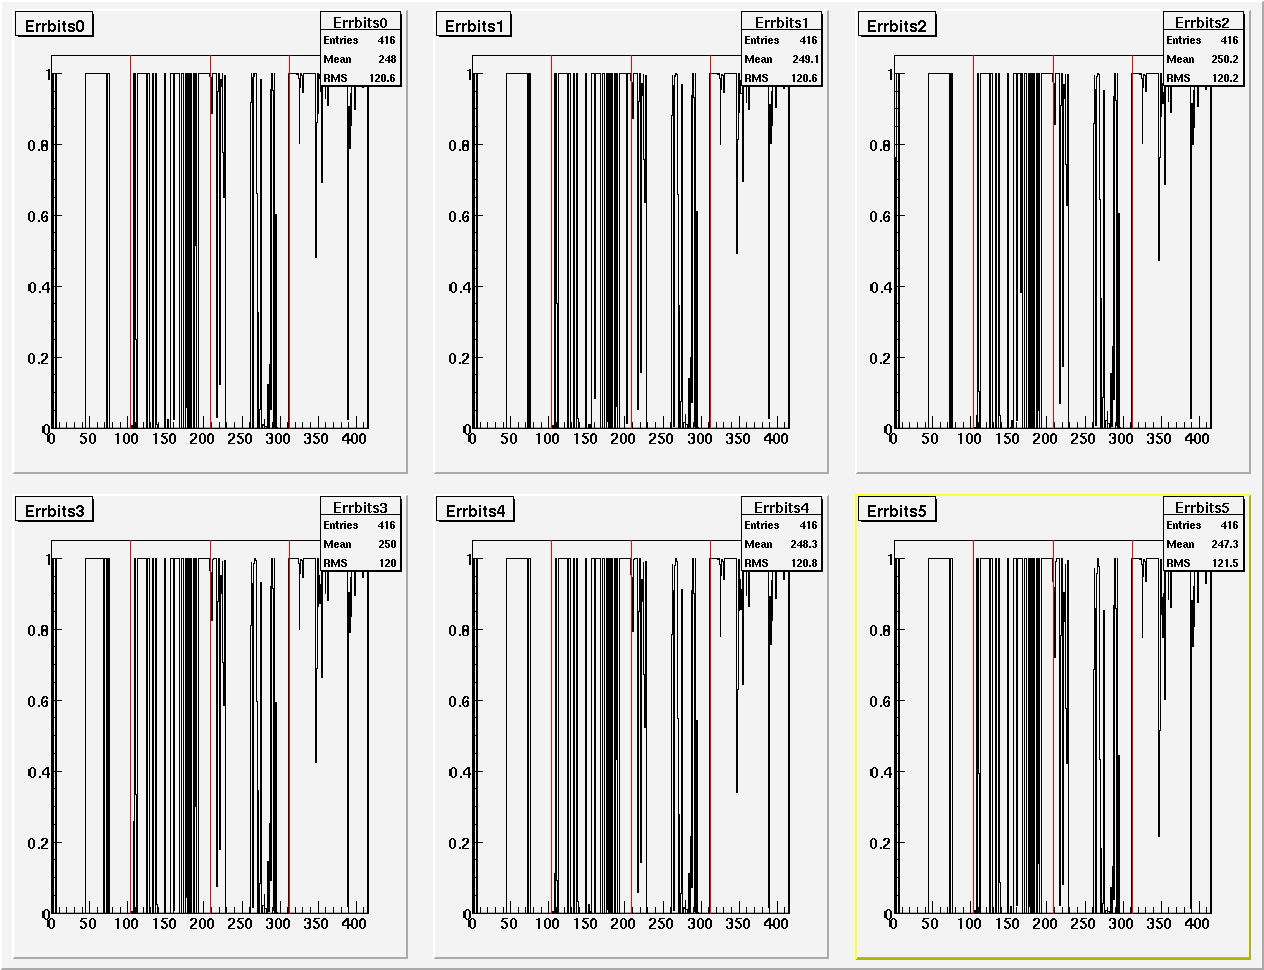
2) For the general error bits: for every run, the error bit was on for 52% of the chips*events. To see if the errors increased with rate, I checked the following:
-found the number of times the error bit was on for each chip in each run
-calculated the fraction of the events for which the error bit was on for that chip
-compared that fraction between runs
For each run, the fraction of events for which error bits were found (y axis) for each chip (x axis):
Stack Order: 7A,7C,8A,8C (red lines)
Boards within each stack: 1S, 1L, 2S, 2L1, 2L2, 3S1, 3S2, 3L1, 3L2
Upper Row: 1kHz, 5kHz, 10kHz; Lower Row: 25kHz, 50kHz, 100kHz.
This is the comparison of the 1kHz run with all of the burst mode runs:
On the y-axis are the number of chips; on the x-axis is the difference between the fraction described above.
Upper Row: 1kHz, 5kHz, 10kHz; Lower Row: 25kHz, 50kHz, 100kHz.