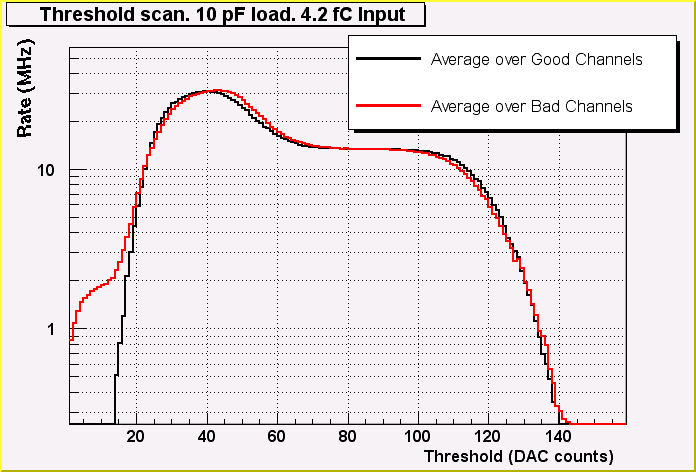
Figure 1. Threshold scan for averaged over good and bad channels for 0 fC input charge. Linear scale.

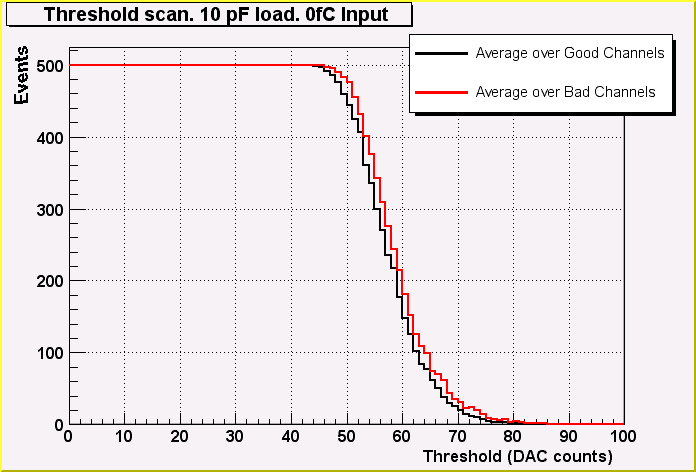
Figure 2. Threshold scan for averaged over good and bad channels for 2 fC input charge. Linear scale.
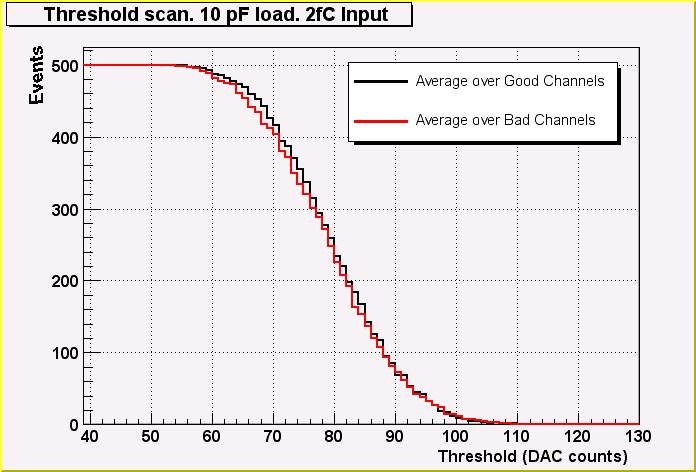
Figure 3. Threshold scan for averaged over good and bad channels for 0 fC input charge. Logarithmic scale.
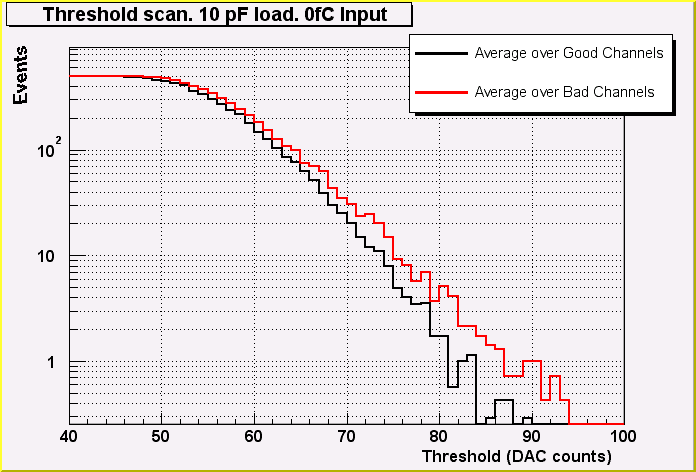
Figure 4. Threshold scan for averaged over good and bad channels for 2 fC input charge. Logarithmic scale.
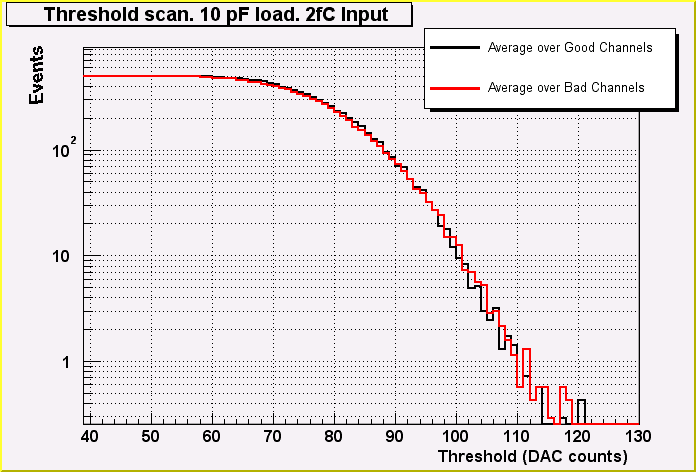
Figure 5. Transitions rate (from 0 to 1 level, 3 bunch crossings) averaged over good and bad channels for 0 fC input charge. Linear scale.
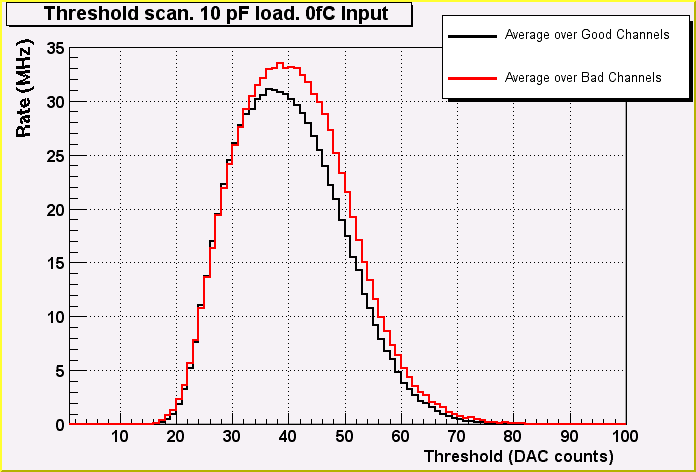
Figure 6. Transitions rate (from 0 to 1 level, 3 bunch crossings) averaged over good and bad channels for 2 fC input charge. Linear scale.
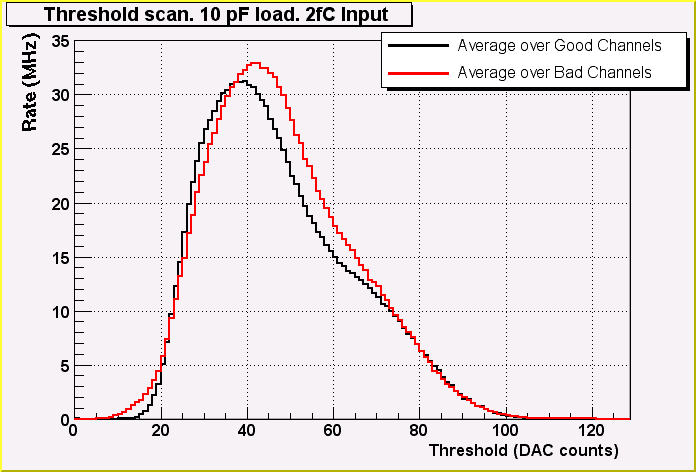
Figure 7. Transitions rate (from 0 to 1 level, 3 bunch crossings) averaged over good and bad channels for 3 fC input charge. Linear scale.
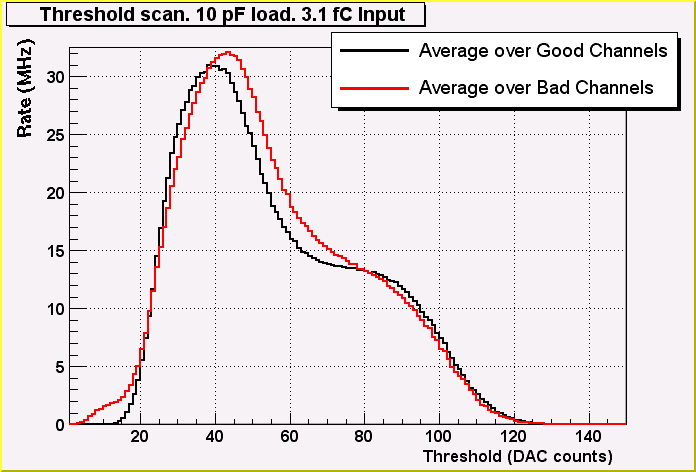
Figure 8. Transitions rate (from 0 to 1 level, 3 bunch crossings) averaged over good and bad channels for 4 fC input charge. Linear scale.
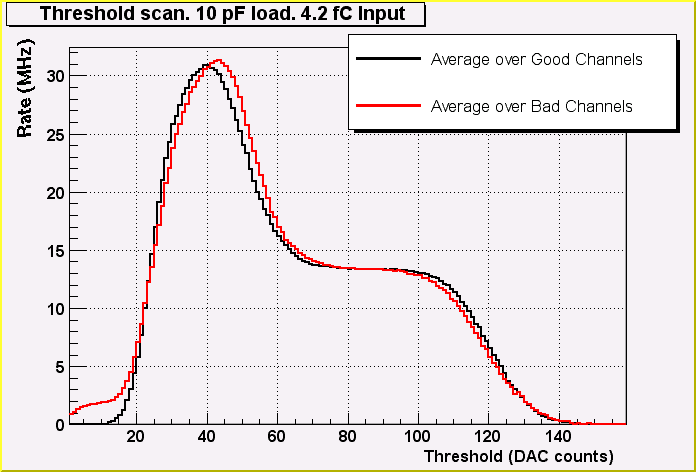
Figure 9. Transitions rate (from 0 to 1 level, 3 bunch crossings) averaged over good and bad channels for 0 fC input charge. Logarithmic scale.
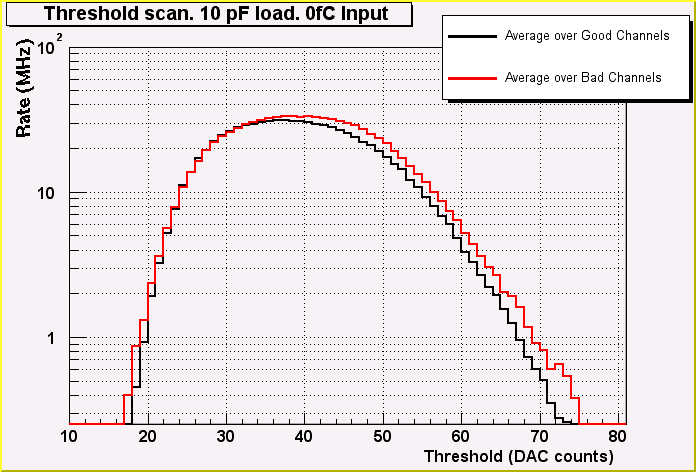
Figure 10. Transitions rate (from 0 to 1 level) averaged over good and bad channels for 2 fC input charge. Logarithmic scale.
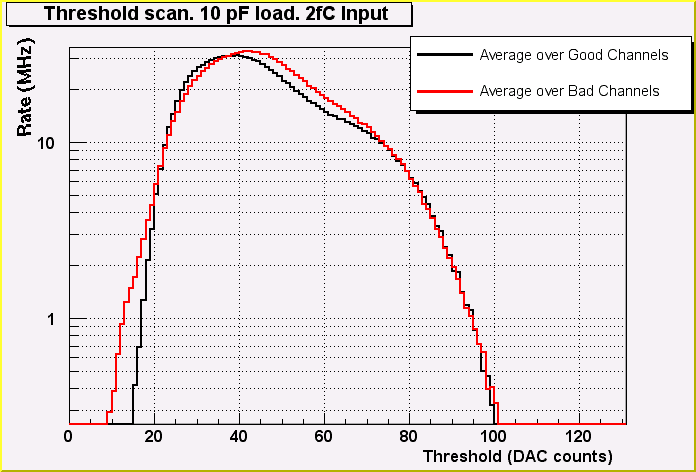
Figure 11. Transitions rate (from 0 to 1 level, 3 bunch crossings) averaged over good and bad channels for 3 fC input charge. Logarithmic scale.
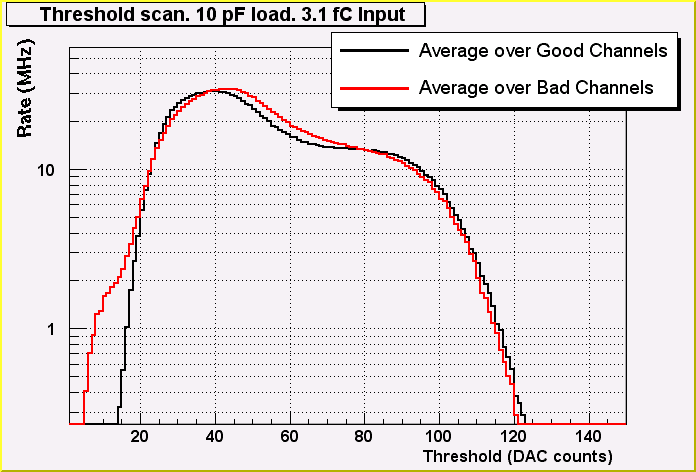
Figure 12. Transitions rate (from 0 to 1 level, 3 bunch crossings) averaged over good and bad channels for 4 fC input charge. Logarithmic scale.
